
Quick answer: The Consumer Price Index (CPI) measures the average change in prices paid by urban consumers for a fixed basket of goods and services. The BLS reported 12-month headline CPI of 3.7% for September 2026 and core CPI, which excludes food and energy, of 2.6%. Inflation = (CPI now ÷ CPI a year ago − 1) × 100.
When news reports say inflation is 3.7%, they are almost always quoting the CPI. It is a very useful index, but it is an average and your own experience may be different. Understanding its construction helps you use it.
Key takeaways
- CPI-U covers about 93% of the U.S. population: all urban consumers.
- Headline CPI includes food and energy; core CPI excludes them because they are volatile.
- The index is built from a basket of goods and services weighted by typical spending.
- Your personal inflation depends on your spending mix, location and age.
- Many contracts and benefits, including Social Security COLAs, use CPI-W, a related index.
The formula
Inflation rate = (CPI this period ÷ CPI same period last year − 1) × 100.
Example: if CPI was 300.0 a year ago and 311.1 now, inflation = (311.1 ÷ 300.0 − 1) × 100 = 3.7%.
What is in the basket
Approximate relative importance of major groups (illustrative weights; the BLS publishes exact current weights):
| Group | Approximate weight |
|---|---|
| Housing | 36% |
| Transportation | 17% |
| Food | 13.5% |
| Medical care | 8% |
| Recreation, education and other | 25.5% |
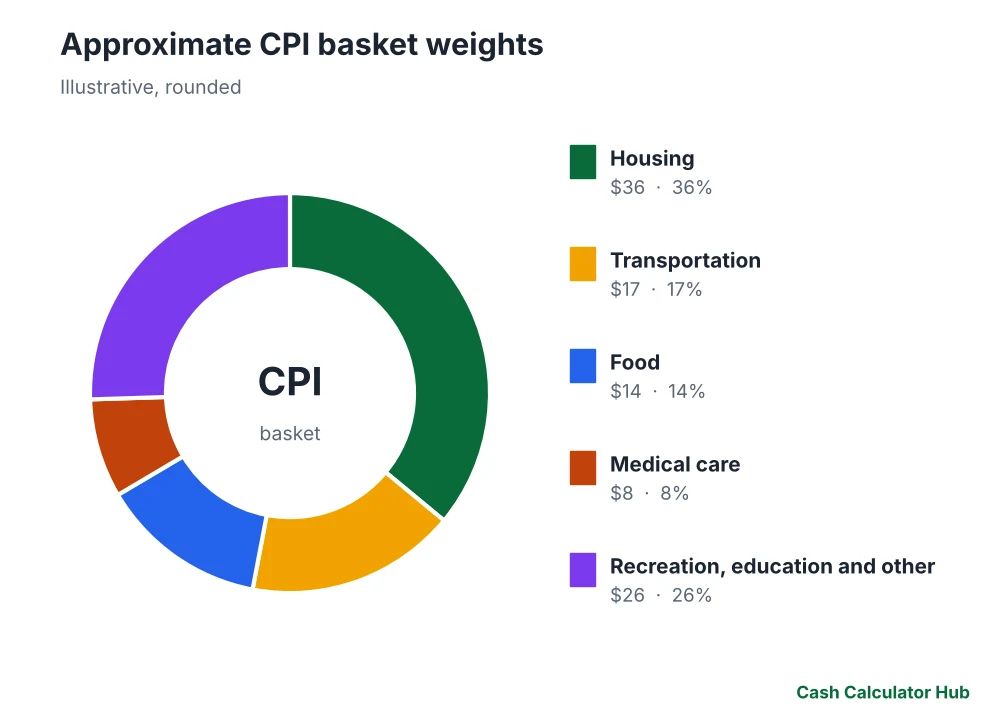
Housing, mainly shelter, is the largest component; it is measured through rents and owners’ equivalent rent, which lags market rents. See rent versus buy.
Headline versus core
| Measure | Includes | Why used |
|---|---|---|
| Headline CPI | All items | Total cost of living change |
| Core CPI | Excludes food and energy | Underlying trend |
| CPI-W | Urban wage earners | Used for Social Security COLA |
| PCE price index | Broader spending measure | The Federal Reserve’s preferred gauge |
Why your inflation may differ
- A renter in a high-cost city faces different shelter inflation than a homeowner with a fixed mortgage.
- Retirees spend more on medical care.
- If you drive a lot, gasoline prices matter more.
- Younger households spend more on rent and education.
What inflation does to money
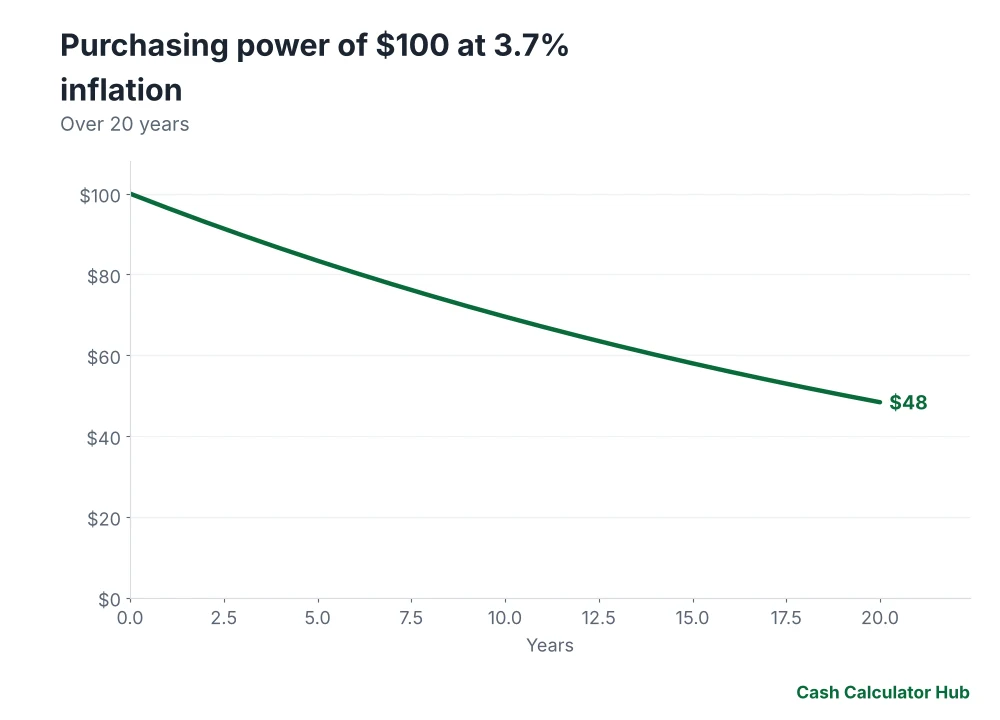
At 3.7% a year, prices double in about 19 years (rule of 72 gives 19).
| Years | Price level at 3.7% | Purchasing power of $100 |
|---|---|---|
| 5 | 120 | 83 |
| 10 | 144 | 70 |
| 20 | 207 | 48 |
See what $100 was worth and real returns after inflation and taxes.
Limits of CPI
CPI is a fixed-weight-style average and adjusts for quality changes and substitution; critics argue it can over- or understate real costs. Use it as a guide, not a personal measure.
Use it
- Compare your raise to inflation: raises vs inflation.
- Adjust retirement budgets: how much you need to retire.
- See Social Security adjustments: COLA history.
Tools
Use the inflation calculator, percentage calculator and cost of living calculator. More: inflation and currency tools.
Frequently asked questions
What is the Consumer Price Index?
A measure of the average change over time in prices paid by urban consumers for a basket of goods and services, published monthly by the BLS.
What is core CPI?
CPI excluding food and energy, used to see the underlying inflation trend.
How is the inflation rate calculated?
(Current CPI ÷ CPI a year earlier − 1) × 100.
Why is my personal inflation different from CPI?
Because CPI is an average of many households; your spending mix, location and age differ.
What was CPI inflation in September 2026?
The BLS reported headline CPI up 3.7% over the previous 12 months and core CPI up 2.6%.
Sources and further reading
How the numbers were made: Inflation arithmetic and the purchasing-power table were computed from the formulas shown. Headline and core CPI figures are the BLS values for September 2026; component weights are rounded illustrations, so check bls.gov/cpi for the current official weights.
Keep reading
This guide is general information, not financial, tax or legal advice. Figures use stated assumptions and 2026 rules and will differ from your situation; check current rules and talk to a licensed professional before you decide. Full disclaimer.

