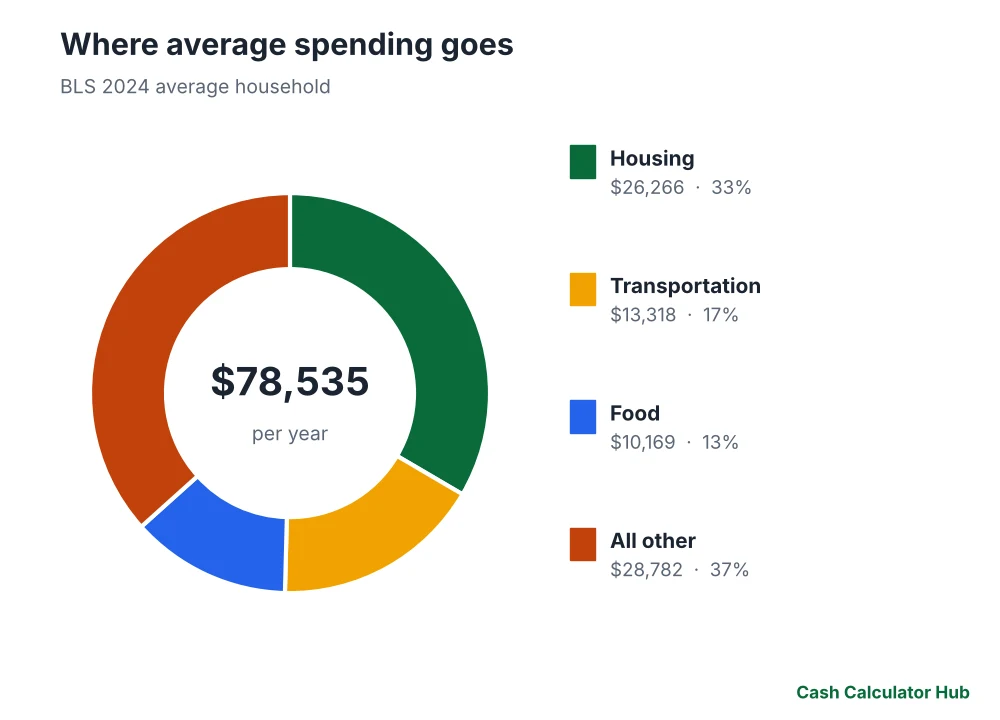
Quick answer: According to the Bureau of Labor Statistics Consumer Expenditure Survey, the average U.S. household spent $78,535 in 2024: housing $26,266 (33%), transportation $13,318 (17%), food $10,169 (13%) and everything else $28,782 (37%). Use these as benchmarks, not targets.
Comparing your budget with national averages can reveal categories where you spend much more or less. Averages hide differences by income, age, region and household size, so treat them as a starting reference. The figures below are from the BLS Consumer Expenditure Surveys for 2024.
Key takeaways
- Average annual spending: $78,535, or $6,545 a month.
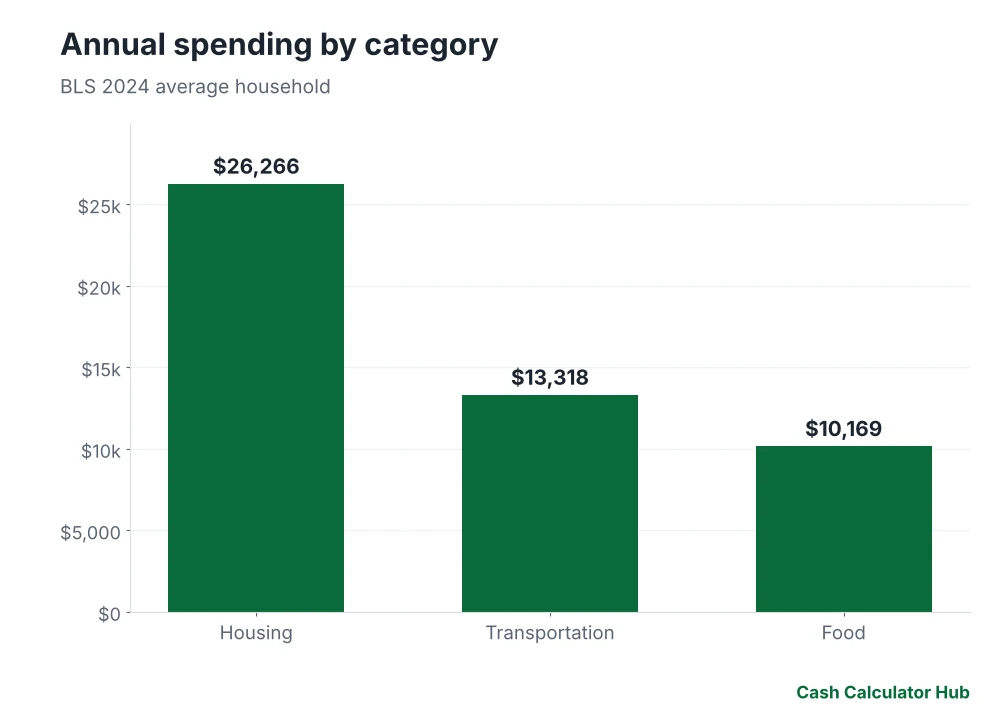
- Housing: $26,266 a year ($2,189 a month).
- Transportation: $13,318; food: $10,169.
- The “everything else” category includes health care, insurance and pensions, entertainment, apparel and more.
- Housing plus transportation is about half of spending for the average household.
The big three
| Category | Annual | Monthly | Share of spending |
|---|---|---|---|
| Housing | $26,266 | $2,189 | 33.4% |
| Transportation | $13,318 | $1,110 | 17.0% |
| Food | $10,169 | $847 | 12.9% |
| All other | $28,782 | $2,398 | 36.6% |
| Total | $78,535 | $6,545 | 100% |
What the averages mean
- Spending is not the same as income: some households save, some borrow.
- The average includes all ages; young and older households differ.
- Housing includes shelter, utilities and household operations.
- “Other” is a large group: health care, insurance and pensions, entertainment, apparel, education and charitable giving.
Compare with your budget
Enter your own numbers:
| Category | Benchmark share | At $60,000 spending | At $90,000 spending |
|---|---|---|---|
| Housing | 33% | $20,067 | $30,100 |
| Transportation | 17% | $10,175 | $15,262 |
| Food | 13% | $7,769 | $11,654 |
| Other | 37% | $21,989 | $32,984 |
How it relates to budget rules
The 50/30/20 rule puts needs at 50% of after-tax income. Average housing, transportation and food together are about 63% of spending. Transportation is often the most controllable; see true cost of owning a car. Compare housing with rent affordability.
Ways to reduce the big categories
- Housing: roommates, a smaller place, refinance when it pays; see refinance break-even.
- Transportation: keep cars longer, shop insurance, consider used; see new vs used.
- Food: plan meals, cook at home, buy store brands.
Tools
Use the budget calculator, budget planner and cost of living calculator. More: budgeting tools.
Frequently asked questions
How much does the average American household spend per year?
$78,535 in 2024 according to the BLS Consumer Expenditure Survey.
What is the biggest household expense?
Housing, at about $26,266 or roughly a third of spending.
How much do Americans spend on food?
About $10,169 a year per household in 2024, including food at home and away.
Is average spending a good target?
It is a benchmark. Your income, location and goals matter more.
Where does this data come from?
The Bureau of Labor Statistics Consumer Expenditure Surveys.
Sources and further reading
- BLS: Consumer Expenditure Surveys
- U.S. Census Bureau: Housing data
- USDA: Food plans and cost of food
How the numbers were made: Spending totals for housing, transportation and food are from BLS Consumer Expenditure Survey 2024 averages; shares and the ‘all other’ remainder were computed by subtraction and rounded. Confirm the latest release at bls.gov/cex.
Keep reading
- The 50/30/20 Budget Rule: How It Works, and How to Adjust It
- How Much Salary Do You Need to Move to a New City?
- What Was $100 Worth in 2000? Inflation, Calculated
- Pay Yourself First: How to Automate Saving So You Actually Do It
- Sinking Funds: How to Save for Irregular Expenses Without Wrecking Your Budget
- Zero-Based Budgeting: Give Every Dollar a Job (With a Worked Example)
This guide is general information, not financial, tax or legal advice. Figures use stated assumptions and 2026 rules and will differ from your situation; check current rules and talk to a licensed professional before you decide. Full disclaimer.