
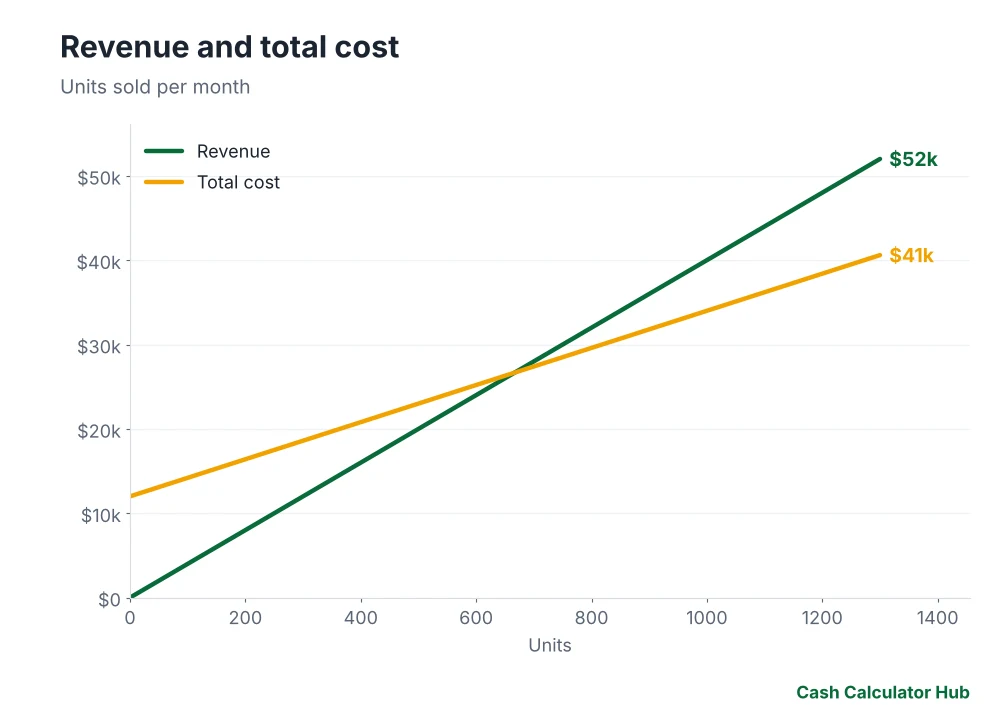
Quick answer: Break-even units = fixed costs ÷ contribution margin per unit, where contribution margin = price − variable cost. With $12,000 of monthly fixed costs, a $40 price and $22 variable cost, the contribution margin is $18 and break-even is 667 units, or $26,667 of revenue, per month.
Every business or side project has a point where revenue just covers costs. Below it you lose money; above it every extra unit adds profit equal to the contribution margin. Knowing the number helps with pricing, hiring and risk.
Key takeaways
- Break-even units = fixed costs ÷ (price − variable cost per unit).
- Break-even revenue = fixed costs ÷ contribution margin ratio.
- Margin of safety = (actual sales − break-even sales) ÷ actual sales.
- Raising price or cutting variable cost lowers break-even; cutting fixed costs does too.
- Use it for pricing, hiring and expansion decisions.
The calculation
| Item | Value |
|---|---|
| Fixed costs per month | $12,000 |
| Price per unit | $40 |
| Variable cost per unit | $22 |
| Contribution margin per unit | $18 |
| Contribution margin ratio | 45% |
| Break-even units | 667 |
| Break-even revenue | $26,667 |
What-if table
| Scenario | Break-even units | Change |
|---|---|---|
| Base | 667 | +0% |
| Price $44 | 545 | -18% |
| Price $36 | 857 | +29% |
| Variable cost $20 | 600 | -10% |
| Fixed costs $15,000 | 833 | +25% |

Margin of safety
If you sell 1,200 units, the margin of safety is (1,200 − 667) ÷ 1,200 = 44%. Profit at 1,200 units = 1,200 × $18 − $12,000 = $9,600.
Target profit
Units needed for a profit of $6,000: ($12,000 + $6,000) ÷ $18 = 1,000.
Limits
Assumes costs are linear, one product and constant prices. Real costs can step up when capacity is reached.
Related
Pair with margins: margin types, and with investment timing: payback period. Pricing: margin vs markup.
Tools
Use the margin calculator, payback period calculator and ROI calculator. More: business and everyday tools.
Frequently asked questions
What is the break-even point?
The level of sales at which total revenue equals total costs, so profit is zero.
How do you calculate break-even units?
Divide fixed costs by the contribution margin per unit.
What is contribution margin?
Price minus variable cost per unit; the amount each sale contributes to fixed costs and profit.
What is margin of safety?
How far actual sales exceed break-even, as a percentage of actual sales.
How can I lower my break-even point?
Raise prices, cut variable costs or reduce fixed costs.
Sources and further reading
How the numbers were made: Every figure on this page was calculated from the formulas and assumptions stated above and rounded to the nearest dollar. Rates, limits and rules are for 2026 unless noted; confirm current figures with the sources listed before acting.
Keep reading
- Margin vs Markup: The Difference, the Formulas and a Conversion Table
- ROI vs IRR vs CAGR: Which Return Number Should You Trust?
- Hourly to Salary: What Is $25 an Hour Per Year?
- Payback Period and Discounted Payback: How Fast Does an Investment Return Your Money?
- Gross Margin vs Operating Margin vs Net Margin: What Each Tells You
- Successive Discounts: Why 20% Off Plus 10% Off Is Not 30% Off
This guide is general information, not financial, tax or legal advice. Figures use stated assumptions and 2026 rules and will differ from your situation; check current rules and talk to a licensed professional before you decide. Full disclaimer.