Quick answer: $10,000 at 7% becomes $81,165 in 30 years. Add $500 a month and it reaches $691,150.
Compound interest is the one financial idea everybody has heard of and almost nobody feels. The numbers are the best way to feel it, so here they are for a plain $10,000.
The formula, in one line
Balance = principal × (1 + r/n)^(n × t)
where r is the annual rate, n is the number of times it compounds per year, and t is the number of years. Interest earns interest, so growth accelerates instead of rising in a straight line.
$10,000 by itself
At 7% compounded monthly:
| Years | Balance | Interest earned |
|---|---|---|
| 5 | $14,176 | $4,176 |
| 10 | $20,097 | $10,097 |
| 20 | $40,387 | $30,387 |
| 30 | $81,165 | $71,165 |
The first ten years roughly double your money. The next ten double it again. By year 30 it is more than 8.1 times what you started with. Notice that the interest earned in the last decade, $40,778, is larger than the total balance at year 10.
Add $500 a month
Most people do not make a single deposit and forget it. Adding $500 a month (about $17 a day):
| Years | You contributed | Balance | Growth |
|---|---|---|---|
| 5 | $40,000 | $49,973 | $9,973 |
| 10 | $70,000 | $106,639 | $36,639 |
| 20 | $130,000 | $300,851 | $170,851 |
| 30 | $190,000 | $691,150 | $501,150 |
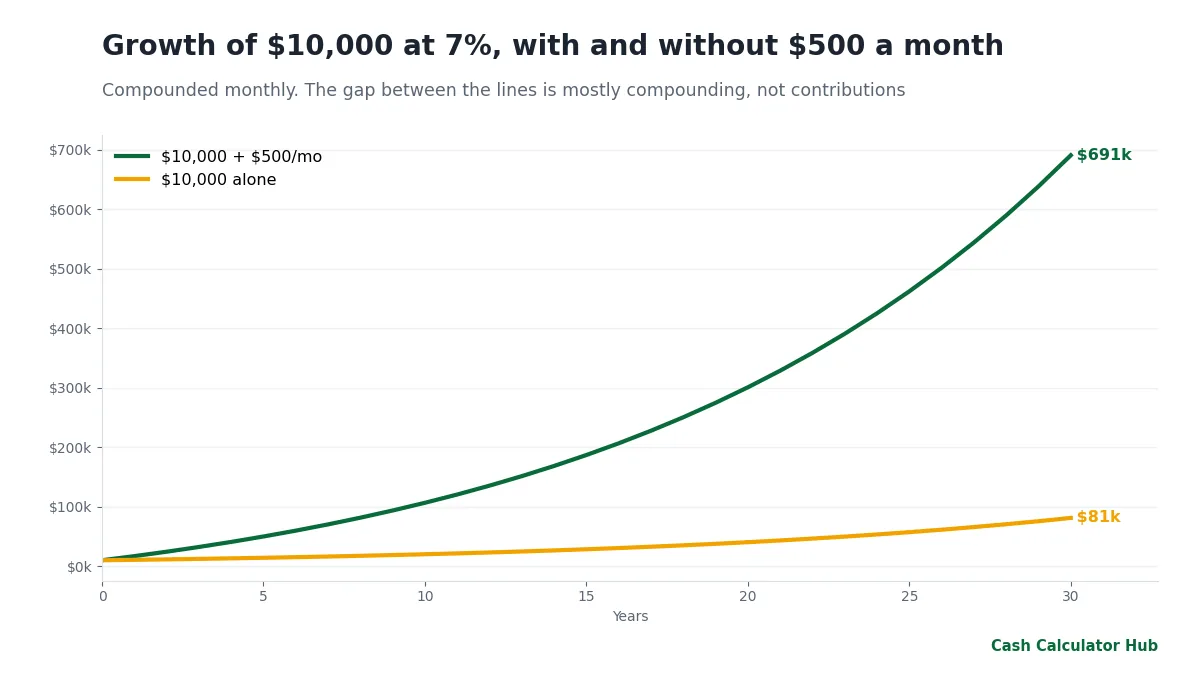
After 30 years you have put in $190,000 and ended up with $691,150. About 73% of the final balance is growth you never typed in. That is the entire argument for starting early, and the reason a 25-year-old saving $300 a month can end up ahead of a 40-year-old saving $600.
Return matters more than most people think
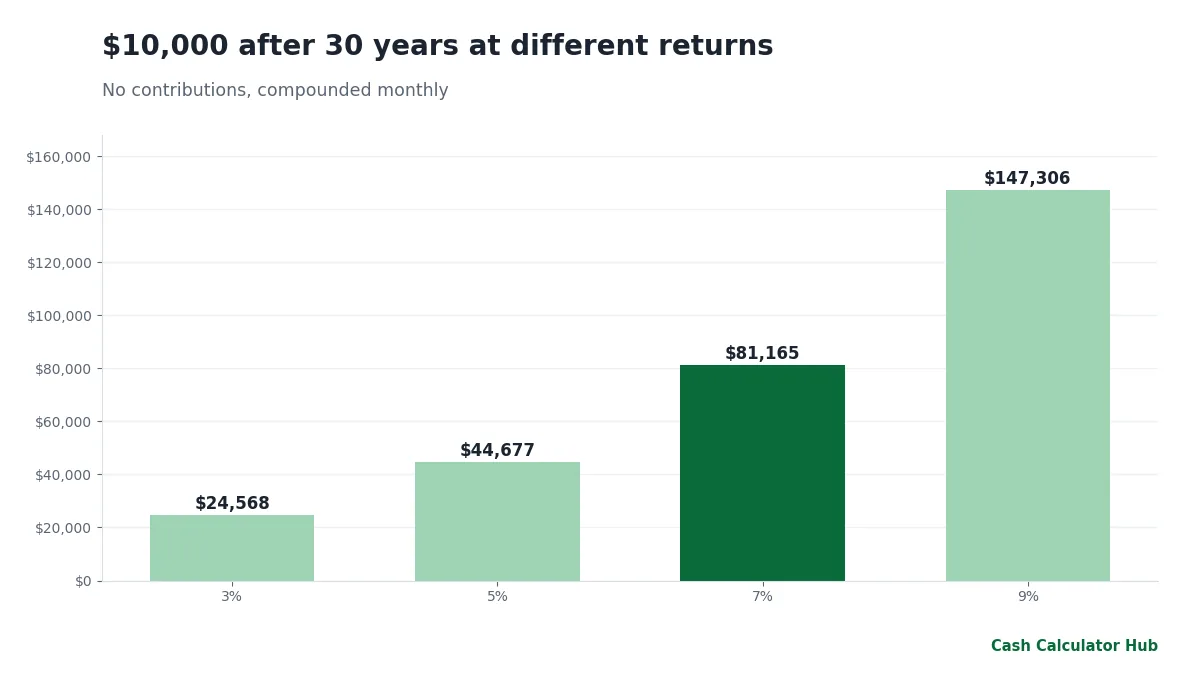
The same $10,000 over 30 years becomes $24,568 at 3%, $81,165 at 7% and $147,306 at 9%. The difference between 7% and 9% is $66,141 with no extra deposits. This is also why fees are so costly; read how fund expense ratios eat your returns.
Does compounding frequency matter?
A little, but much less than the rate. $10,000 at 7% for 10 years:
| Compounding | Result |
|---|---|
| Annually | $19,672 |
| Quarterly | $20,016 |
| Monthly | $20,097 |
| Daily | $20,136 |
The gap between annual and daily is only about $465. A half point of rate is worth far more than switching to daily compounding. Many savings accounts advertise APY, which already includes compounding, so compare APYs, not stated rates.
The rule of 72
Divide 72 by the annual return to estimate how many years it takes to double. At 7%, 72 ÷ 7 ≈ 10.3 years (the exact figure is 10.2). At 4% it is 18 years. At 10% it is about 7. It is a useful mental model and it works backward too: if you want to double in 12 years, you need about 6%.
Two honest caveats
Returns are not guaranteed. The 7% figure is a long-run illustration, not a promise. Stocks can fall 30% or more in a year. Real portfolios have good and bad stretches, and the order of returns matters when you are withdrawing. Use the calculator to compare scenarios, not to predict the future.
Inflation eats part of it. At 3% inflation, $691,150 in 30 years buys what about $284,745 buys today. That is still a lot, but it is a different number. Our guide on what $100 was worth in the past shows how large the effect is.
Use your own numbers
The compound interest calculator lets you change the rate, term and compounding. For regular deposits and goals, try the investment calculator and the future value calculator. Want to know how long a bigger target takes? Read how long it takes to save $1 million. More tools: investment calculators.
Four ways people break compounding
- Cashing out at job changes. Withdrawing a 401(k) early often costs taxes and a 10% penalty, and ends decades of growth on that money.
- Letting fees run. Fees come out of the return you were going to compound. See the fee comparison.
- Waiting for the “right time.” The same $500 monthly deposit started 10 years later ends far lower: $260,463 instead of $609,985 at 7%.
- Ignoring taxes. In a taxable account, taxes on dividends and gains reduce your effective return. If a 7% return becomes 6% after tax drag, $500 a month for 30 years ends near $502,258 instead of $609,985. That is why tax-advantaged accounts such as a 401(k) and IRA matter; see 2026 contribution limits.
Simple versus compound, side by side
On $10,000 at 7% for 30 years, simple interest would add $21,000 for a total of $31,000. Compound interest adds $71,165. The curve starts nearly identical and then pulls away, which is why the early years feel disappointing and the late years feel almost unfair. Run your own comparison in the simple interest calculator next to the compound one.
How much will $10,000 be worth in 20 years?
At 7%, about $40,387 with no additional deposits. At 5% it is about $27,126.
What is the difference between simple and compound interest?
Simple interest is paid only on the original principal. Compound interest is paid on principal plus previously earned interest. Over long periods the gap is huge: at 7% for 30 years, simple interest gives $31,000 while compounding gives $81,165.
Is 7% a realistic return?
It is a common long-run planning figure for a diversified stock portfolio before inflation and fees. It is not guaranteed.
Is it better to invest a lump sum or monthly?
Whichever you can actually do. Starting earlier matters more than the method.
Sources and further reading
How the numbers were made: Every figure on this page was calculated from the formulas and assumptions stated above and rounded. Rates, limits and rules are for 2026 unless noted; confirm current figures with the sources listed before acting.
Keep reading
- How Expense Ratios Quietly Cost You Six Figures
- What Was $100 Worth in 2000? Inflation, Calculated
- How Long Does It Take to Save $1 Million?
- Savings Account vs CD: Which Earns More for Your Cash?
- ROI vs IRR vs CAGR: Which Return Number Should You Trust?
- High-Yield Savings Accounts: APY, Insurance Limits and What You Really Earn
This guide is general information, not financial, tax or legal advice. Figures use stated assumptions and 2026 rules and will differ from your situation; check current rules and talk to a licensed professional before you decide. Full disclaimer.