Quick answer: The 2026 federal income tax brackets for single, married and head of household filers, plus the standard deduction and how marginal vs effective rates work.
The single biggest tax misunderstanding is that earning more can leave you with less money because you “jumped into a higher bracket.” That is not how brackets work. Here is the 2026 structure and how to read it.
2026 federal brackets (taxable income)
Single
| Rate | Taxable income |
|---|---|
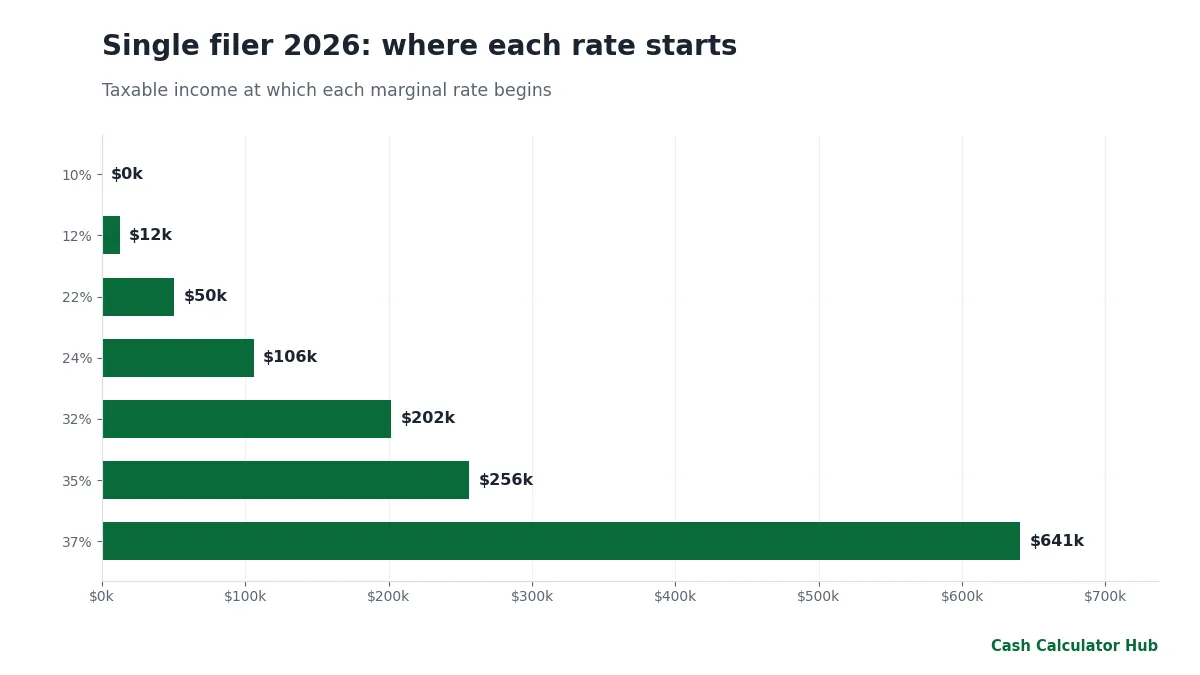
| 10% | up to $12,400 |
| 12% | $12,401 to $50,400 |
| 22% | $50,401 to $105,700 |
| 24% | $105,701 to $201,775 |
| 32% | $201,776 to $256,225 |
| 35% | $256,226 to $640,600 |
| 37% | over $640,600 |
Married filing jointly
| Rate | Taxable income |
|---|---|
| 10% | up to $24,800 |
| 12% | $24,801 to $100,800 |
| 22% | $100,801 to $211,400 |
| 24% | $211,401 to $403,550 |
| 32% | $403,551 to $512,450 |
| 35% | $512,451 to $768,700 |
| 37% | over $768,700 |
Head of household: 10% to $17,700; 12% to $67,450; 22% to $105,700; 24% to $201,775; 32% to $256,200; 35% to $640,600; 37% above.
The standard deduction for 2026
- Single: $16,100
- Married filing jointly: $32,200
- Head of household: $24,150
Brackets apply to taxable income, which is what is left after the deduction. So a single filer can earn $16,100 of wages and owe no federal income tax at all, and a $60,000 salary has taxable income of $43,900.
How the brackets really work
Each rate applies only to the slice of income inside its band. Take $60,000 of wages, single:
- Taxable income: $43,900
- First $12,400 at 10% = $1,240
- Next $31,500 at 12% = $3,780
- Total federal tax: $5,020
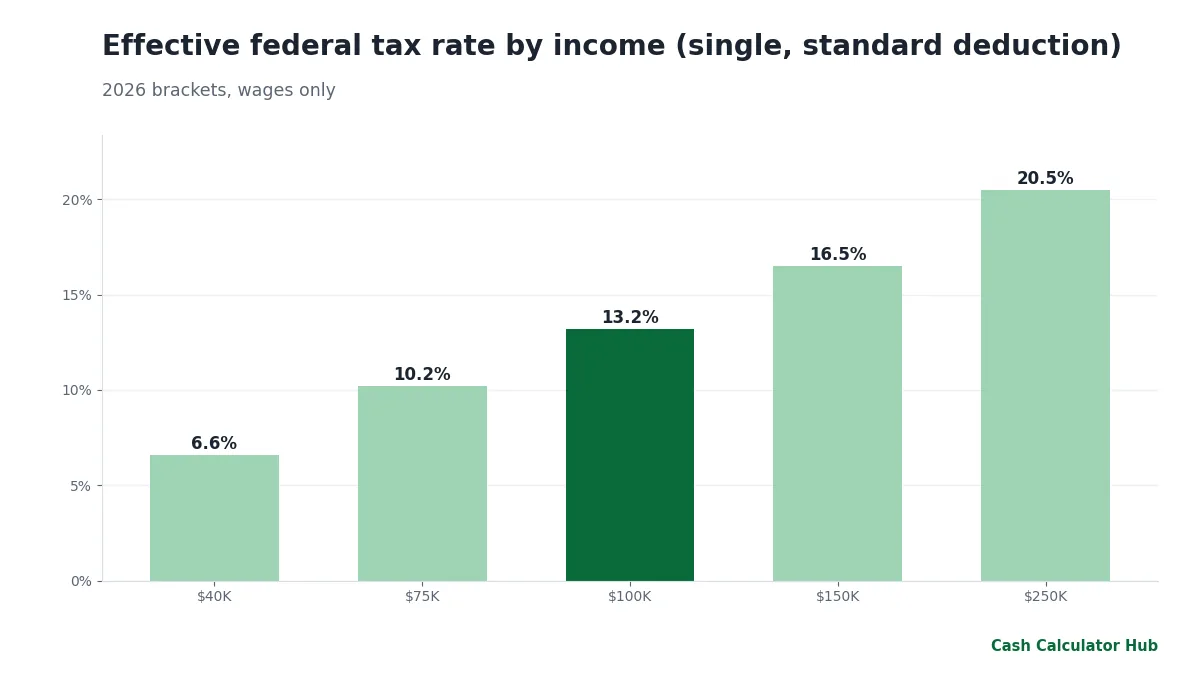
That is an effective rate of 8.4% of gross wages, even though the marginal rate (the rate on your next dollar) is 12%.
If you get a $5,000 raise, the extra $5,000 is taxed at your marginal rate. Your tax on the first $60,000 does not change. You can never lose money by earning more because of a bracket. (Income-based phase-outs for credits are a different matter.)
Beyond the brackets
- Payroll tax (FICA). 6.2% Social Security (up to $184,500 of wages in 2026) plus 1.45% Medicare, plus 0.9% additional Medicare above $200,000 single or $250,000 joint.
- Long-term capital gains have their own rates (0%, 15%, 20%) depending on taxable income.
- State income tax, in most states.
- New temporary deductions. The 2025 tax law added several temporary deductions, such as for tipped income, overtime pay, certain vehicle loan interest and an additional deduction for seniors. They have income limits and phase-outs, so check the current IRS guidance for whether you qualify.
Using brackets in planning
- Know your marginal rate. It is the rate that tells you what a deduction or contribution is worth. A $5,000 traditional 401(k) contribution at 22% saves $1,100.
- Fill low brackets deliberately. In a low-income year, a Roth conversion or realizing gains can make sense; see Roth versus traditional.
- Watch the edges. If you are $2,000 over a bracket, the extra income is taxed at the higher rate only on that $2,000, not on everything.
- Married couples: compare the two filing methods; see the marriage penalty guide.
Calculate your own
The income tax calculator applies all of these figures, including FICA and self-employment tax, and shows your marginal and effective rates. To see what lands in your pocket each pay period, use the take-home paycheck calculator; for an example at $100,000 read what $100K is after taxes. Explore all tax calculators.
Myths worth dropping
- “A raise can push me into a bracket and reduce my take-home pay.” Only the dollars above the threshold are taxed at the higher rate.
- “Tax withholding equals what I owe.” Withholding is an estimate. Your actual tax depends on the return.
- “Deductions lower my tax by their full amount.” A deduction lowers taxable income, so it saves your marginal rate times the amount.
- “Bonuses are taxed at a higher rate.” They are often withheld at a flat rate but taxed at your regular rates when you file.
Capital gains in the same picture
Long-term capital gains and qualified dividends are taxed at 0%, 15% or 20% depending on taxable income, stacked on top of ordinary income. A retiree in a low bracket can have a 0% rate on some gains. Short-term gains are taxed at ordinary rates. This is why the timing of sales matters, and why you should see your bracket with the income tax calculator before selling an asset.
What tax bracket am I in?
Subtract the standard deduction (or itemized deductions) and other adjustments from your income, then find the result in the table for your filing status.
Do I pay the higher rate on all my income?
No. Only on the part of income inside the higher bracket.
Are brackets different for 2025?
Yes, they are adjusted annually for inflation. The 2025 single standard deduction was $15,750, for example.
Does a raise ever reduce take-home pay?
Not because of bracket changes. Losing income-tested benefits or credits can create that effect in some cases.
Sources and further reading
How the numbers were made: Every figure on this page was calculated from the formulas and assumptions stated above and rounded. Rates, limits and rules are for 2026 unless noted; confirm current figures with the sources listed before acting.
Keep reading
- Roth vs Traditional 401(k) and IRA: How to Decide
- Marriage Tax Penalty or Bonus: Who Pays More in 2026?
- How Much Is a $100,000 Salary After Taxes in 2026?
- Standard vs Itemized Deduction 2026: Which Saves You More?
- Capital Gains Tax Rates 2026: 0%, 15% and 20% Brackets Explained
- Roth Conversion Explained: When Paying Tax Now Beats Paying Later
This guide is general information, not financial, tax or legal advice. Figures use stated assumptions and 2026 rules and will differ from your situation; check current rules and talk to a licensed professional before you decide. Full disclaimer.